AI is moving from answering questions to taking actions. But action is not prediction. Before a system changes a lab protocol, recommends a treatment or drives a robot, it has to answer a harder question: what would my action actually change?
That question has a mature body of methods behind it — and almost nobody outside the field can use them. Causal-Copilot is an attempt to close that distance by turning causal analysis from an algorithm you have to choose into a loop that runs itself and shows its work.
The gap
- Algorithmic complexity. Twenty-plus methods, each with its own assumptions, hyperparameters and failure modes.
- A steep learning curve. Using them well demands fluency in causal theory and in the implementations.
- Selection is the real bottleneck. Running PC or GES is easy. Knowing which one this particular dataset warrants — and being able to defend that choice afterwards — is the part that stops people.
The system
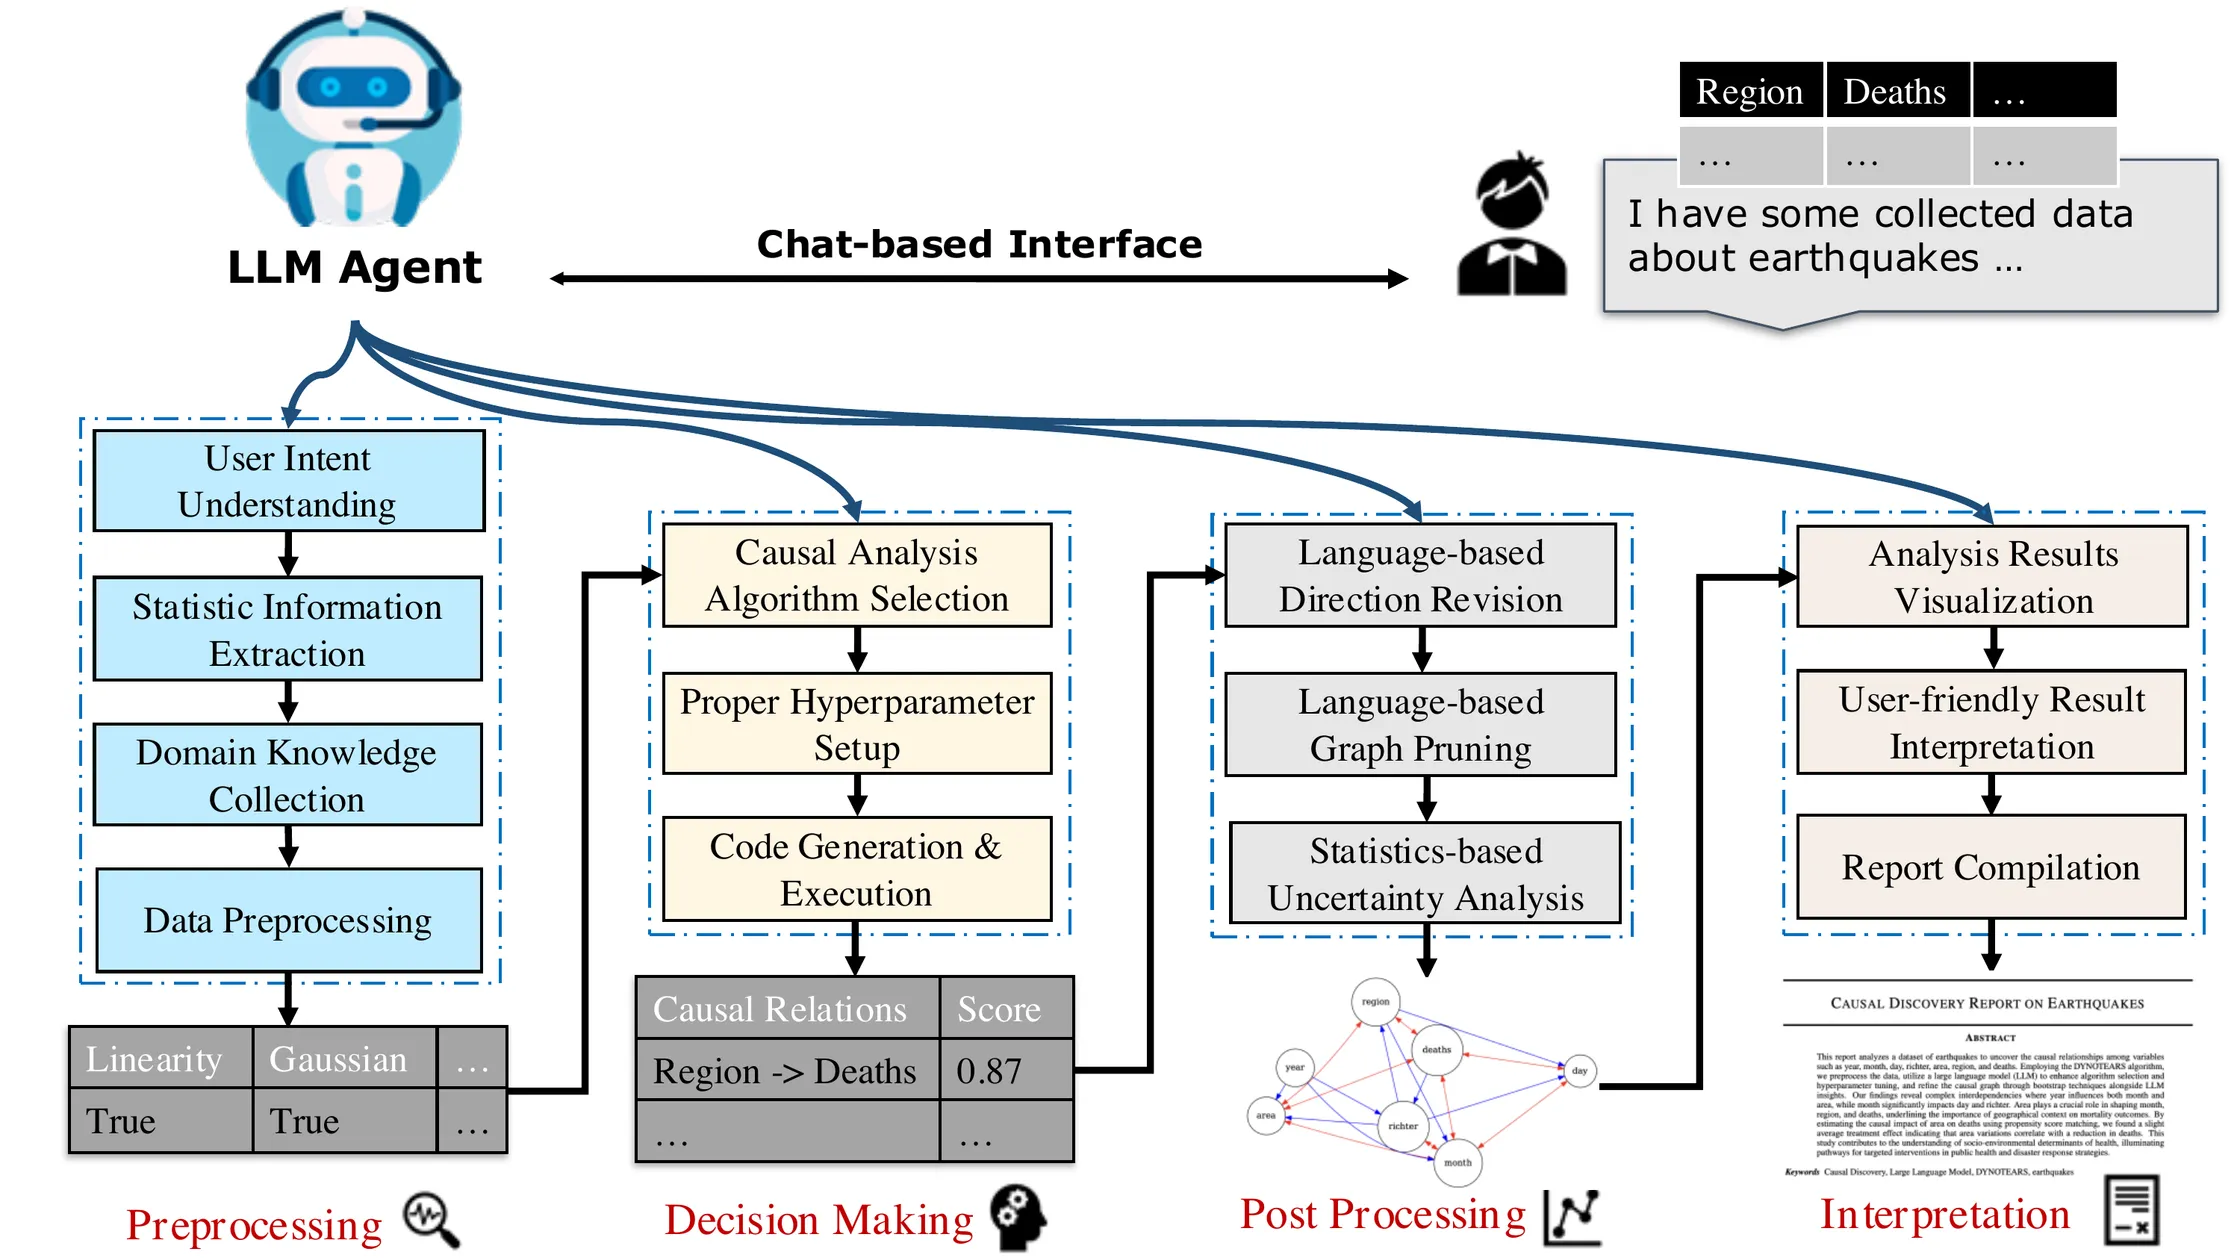
A user uploads data and describes the goal in natural language. Five modules do the rest, with an LLM coordinating them rather than replacing them.
User interaction. Parses the query, takes in domain knowledge, and keeps a feedback loop open so the user can push back.
Preprocessing. Cleaning, schema extraction and — the part that turns out to matter most — statistical diagnosis: testing for linearity, stationarity and heterogeneity before any method is chosen.
Algorithm selection. Filters and ranks candidate methods against the measured characteristics of the data, then configures their hyperparameters.
Postprocessing. Bootstrap resampling for edge confidence, weak-edge pruning, and the LLM acting as a plausibility check on moderate-confidence edges only — not as the source of the graph.
Report generation. Graph visualization, interpretation of the results, and a compiled report.
The division of labour is the design: statistics decide what is supportable, the LLM decides what is sensible, and the boundary between them is deliberate.
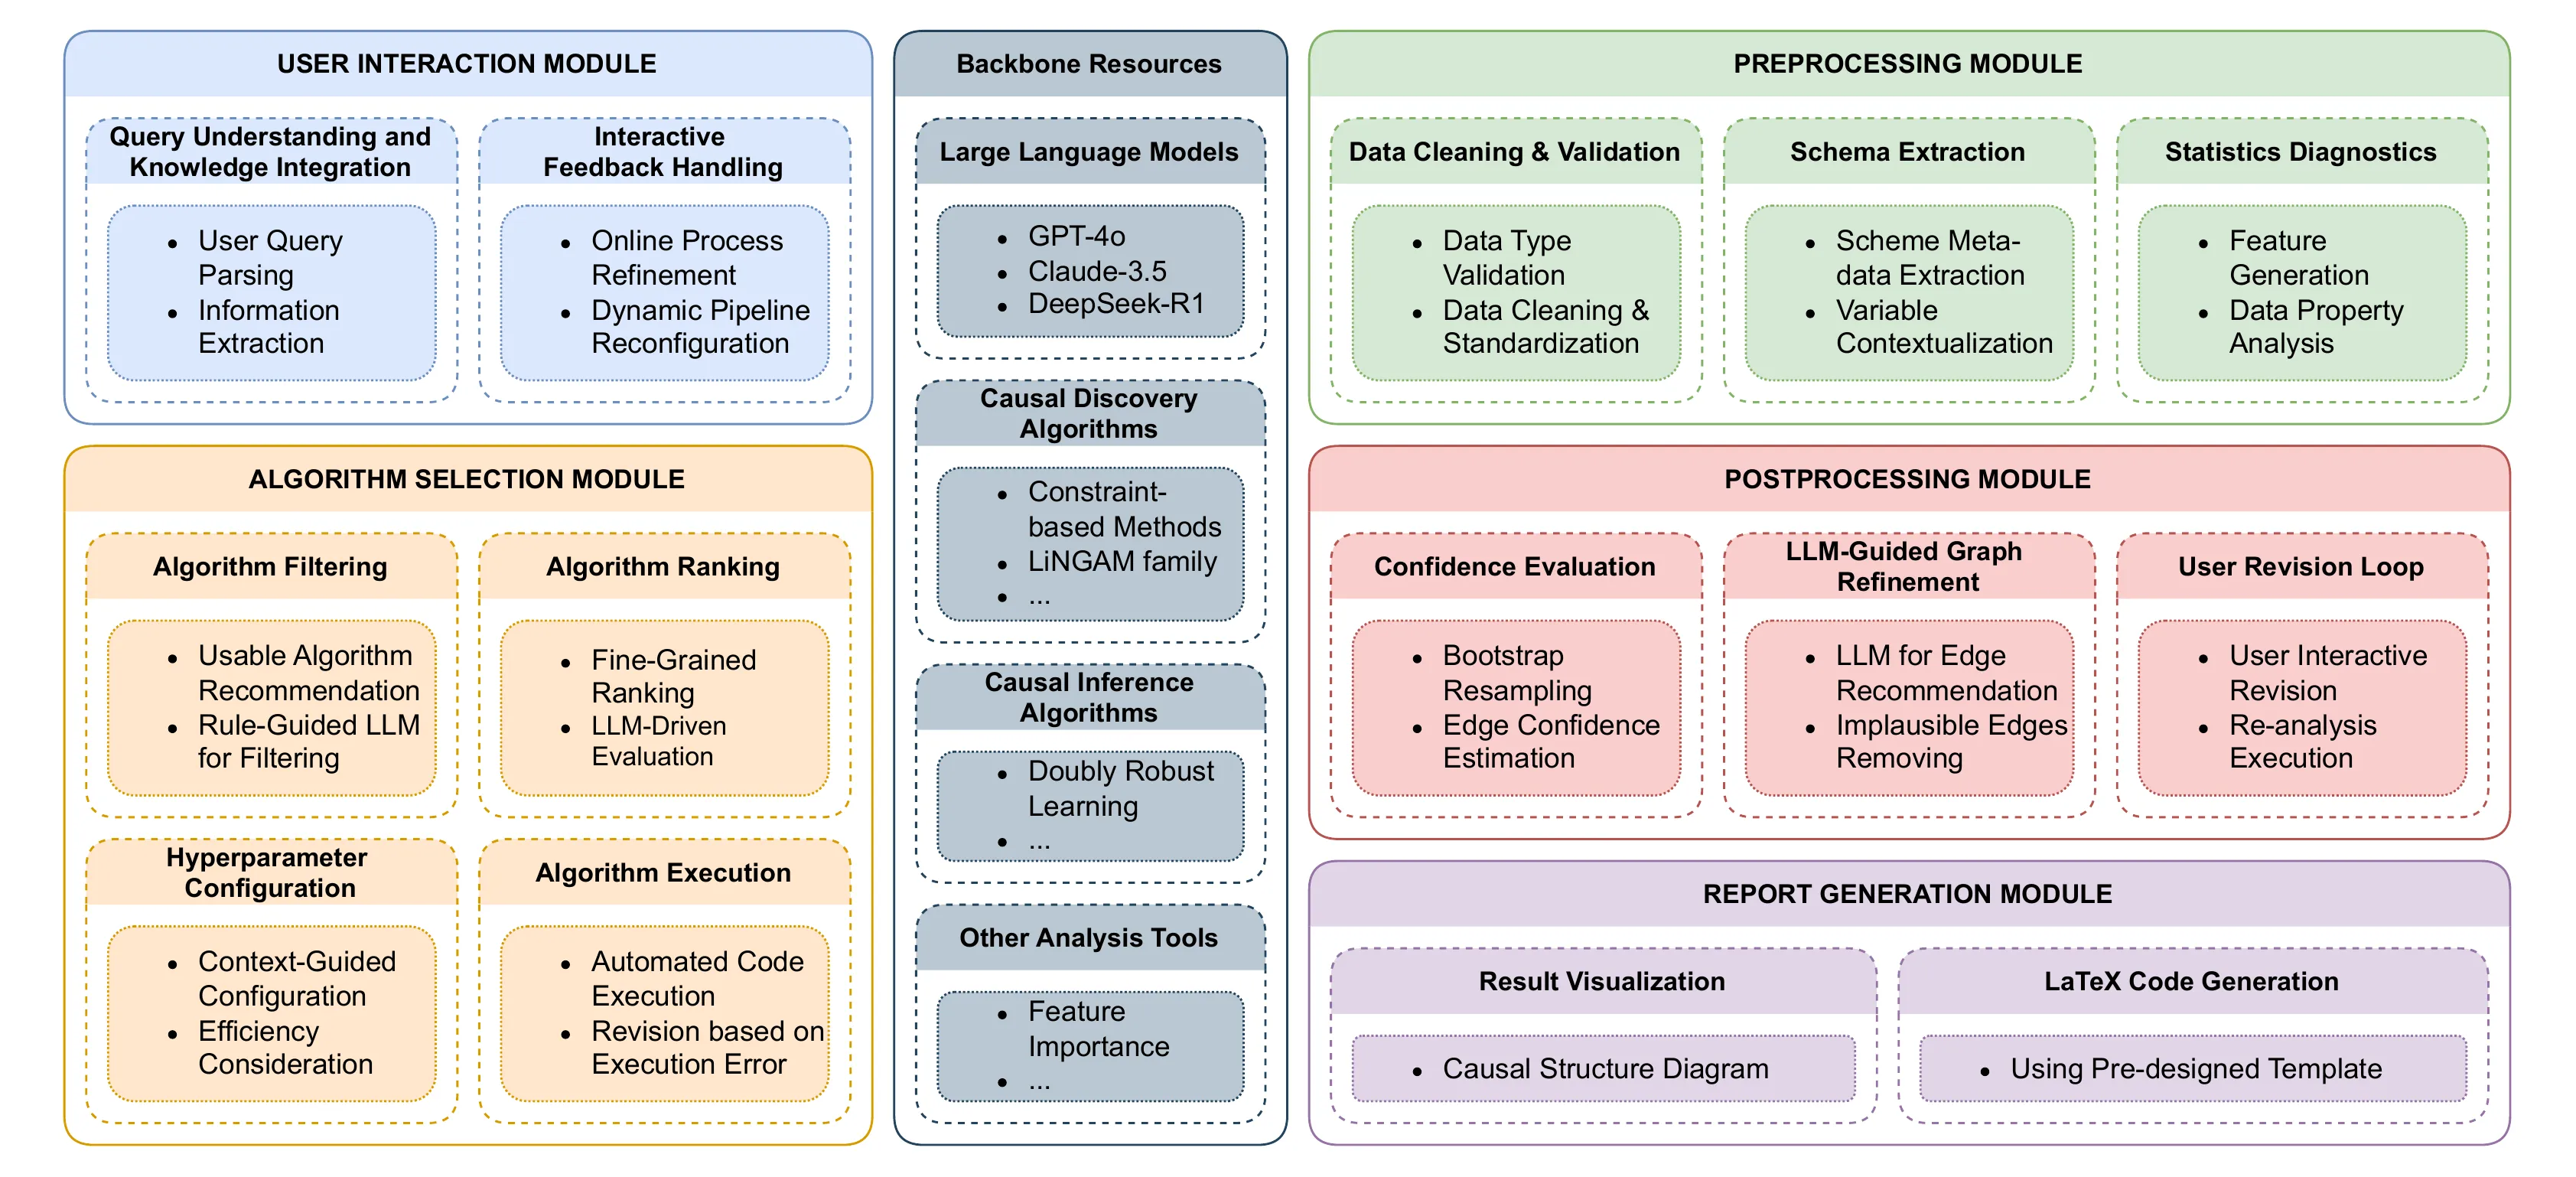 Modular architecture. Five components around an LLM that coordinates them. Every module is replaceable and new algorithms plug in through a common interface, which is what makes the library expandable without touching the agent.
Making selection empirical
Behind the selection module sits a benchmarking study that is easy to overlook and does most of the real work. Every supported algorithm was profiled across a grid of conditions — dimensionality, graph density, sample size, linear versus non-linear relationships, noise type, discreteness, measurement error and missingness, plus lag structure and temporal density for time series.
Those results are what the selection module consults. The point is not that some method is universally best — none is. The point is to make algorithm selection empirical rather than habitual.
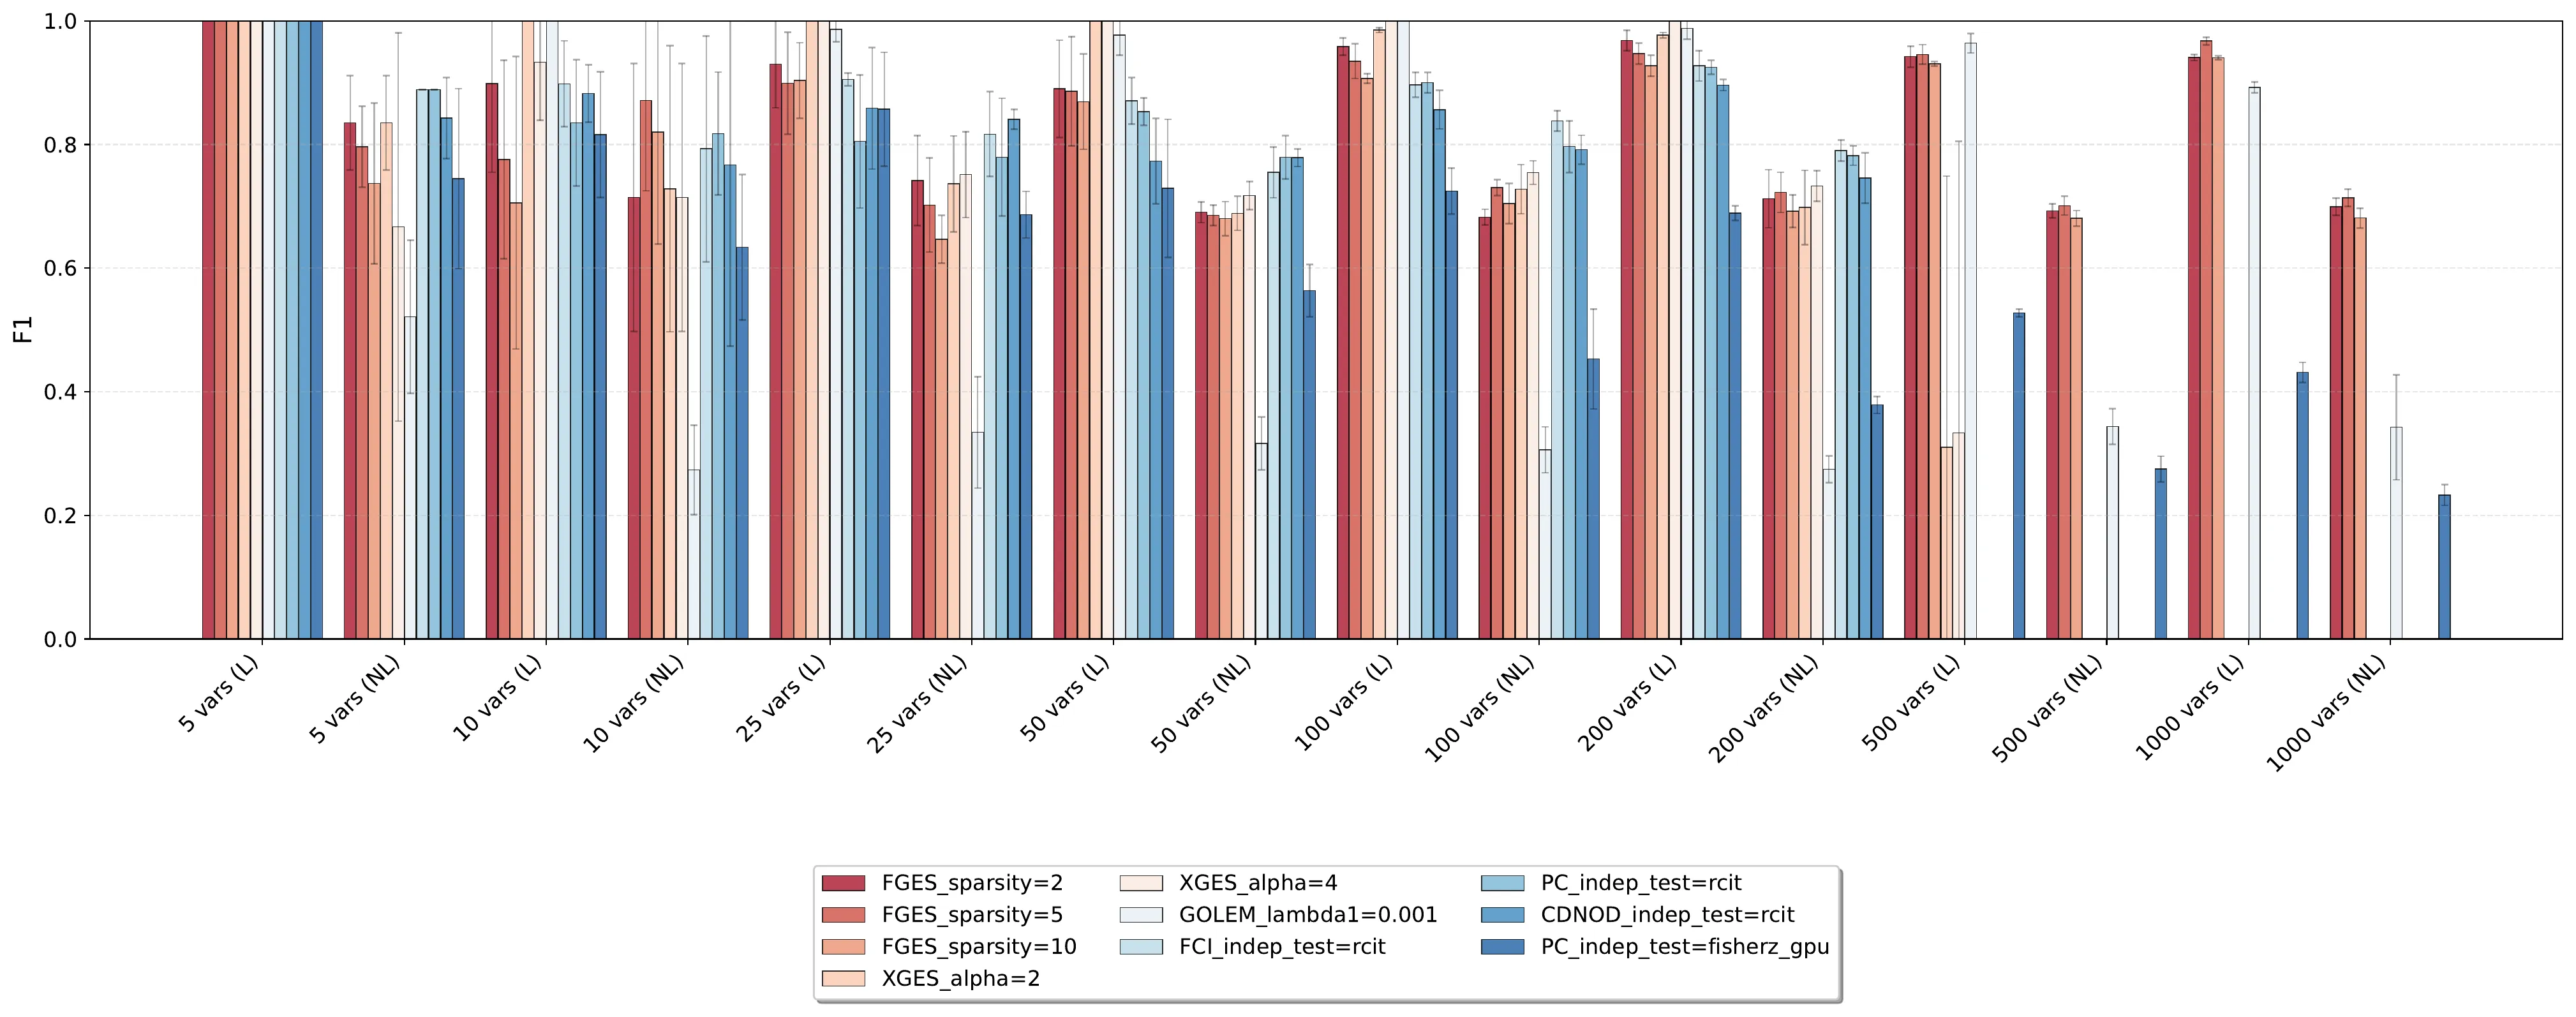 Why defaults fail. Average F1 across algorithm configurations as the number of variables grows. Methods that are indistinguishable on small, clean problems separate sharply as conditions get harder — which is exactly where a fixed default does the most damage.
Runtime and time-series profiling
Accuracy is only half of it. A method that would eventually find the right graph is useless if it does not return, and the runtime spread across these methods is enormous — orders of magnitude at the same problem size. Several otherwise reasonable choices become unusable long before the data itself becomes difficult, so the selection module has to weigh cost alongside expected quality.
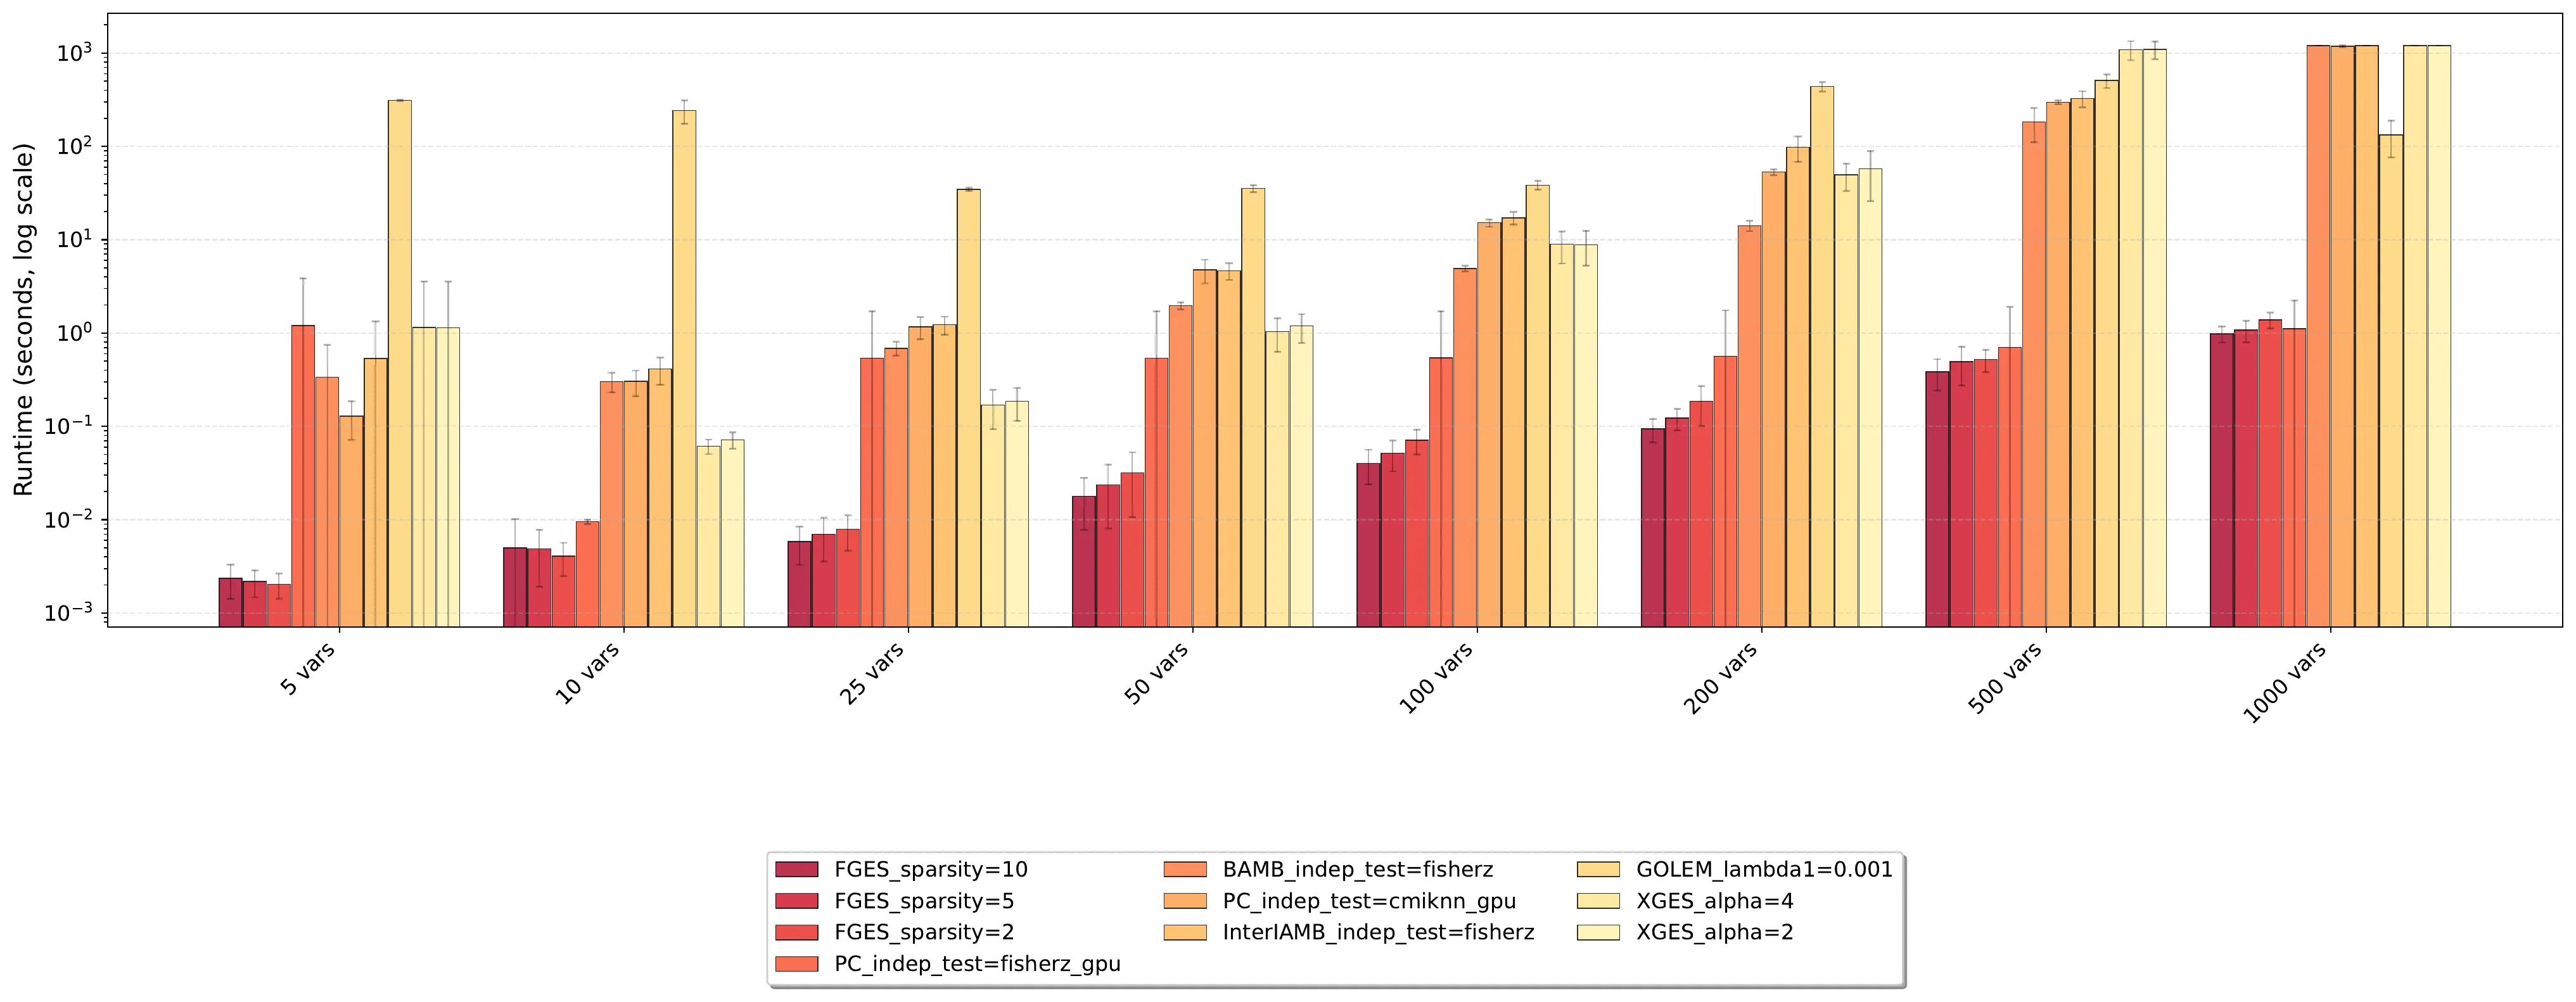 Runtime against problem size. Seconds on a logarithmic scale as the number of variables grows. The gap between the cheapest and most expensive configurations spans several orders of magnitude at the same number of variables.
The same profiling is repeated for time series, where the governing axis is lag structure rather than graph density — a method that handles short lags well can degrade badly once dependencies stretch further back.
Coverage
Causal-Copilot integrates 20+ methods across three families. Discovery spans constraint-based approaches (PC, FCI, CD-NOD, PCMCI), score-based search (GES, FGES, XGES, GRaSP), continuous optimization (NOTEARS, GOLEM, CALM, CORL, DYNOTEARS), the LiNGAM family, Markov-blanket methods and Granger causality. Inference covers double machine learning, doubly robust learning, instrumental variables, matching and counterfactual estimation. Auxiliary tools add SHAP-based feature importance and causal root-cause analysis.
It is assembled on established libraries rather than reimplemented — causal-learn, gCastle, CausalNex and Tigramite for discovery, DoWhy and EconML for inference — and several paths are GPU-accelerated, including accelerated LiNGAM and GPU skeleton discovery. That engineering is not decoration: it is why thousand-node problems are reachable at all.
Results
Evaluation runs against both classical algorithms and a non-contextualized GPT-4o baseline — given the same query and the same menu of methods and hyperparameters, but without the statistical diagnosis and causal expertise. That comparison is the one that matters for an LLM agent: it isolates the value of the scaffolding from the value of the model.
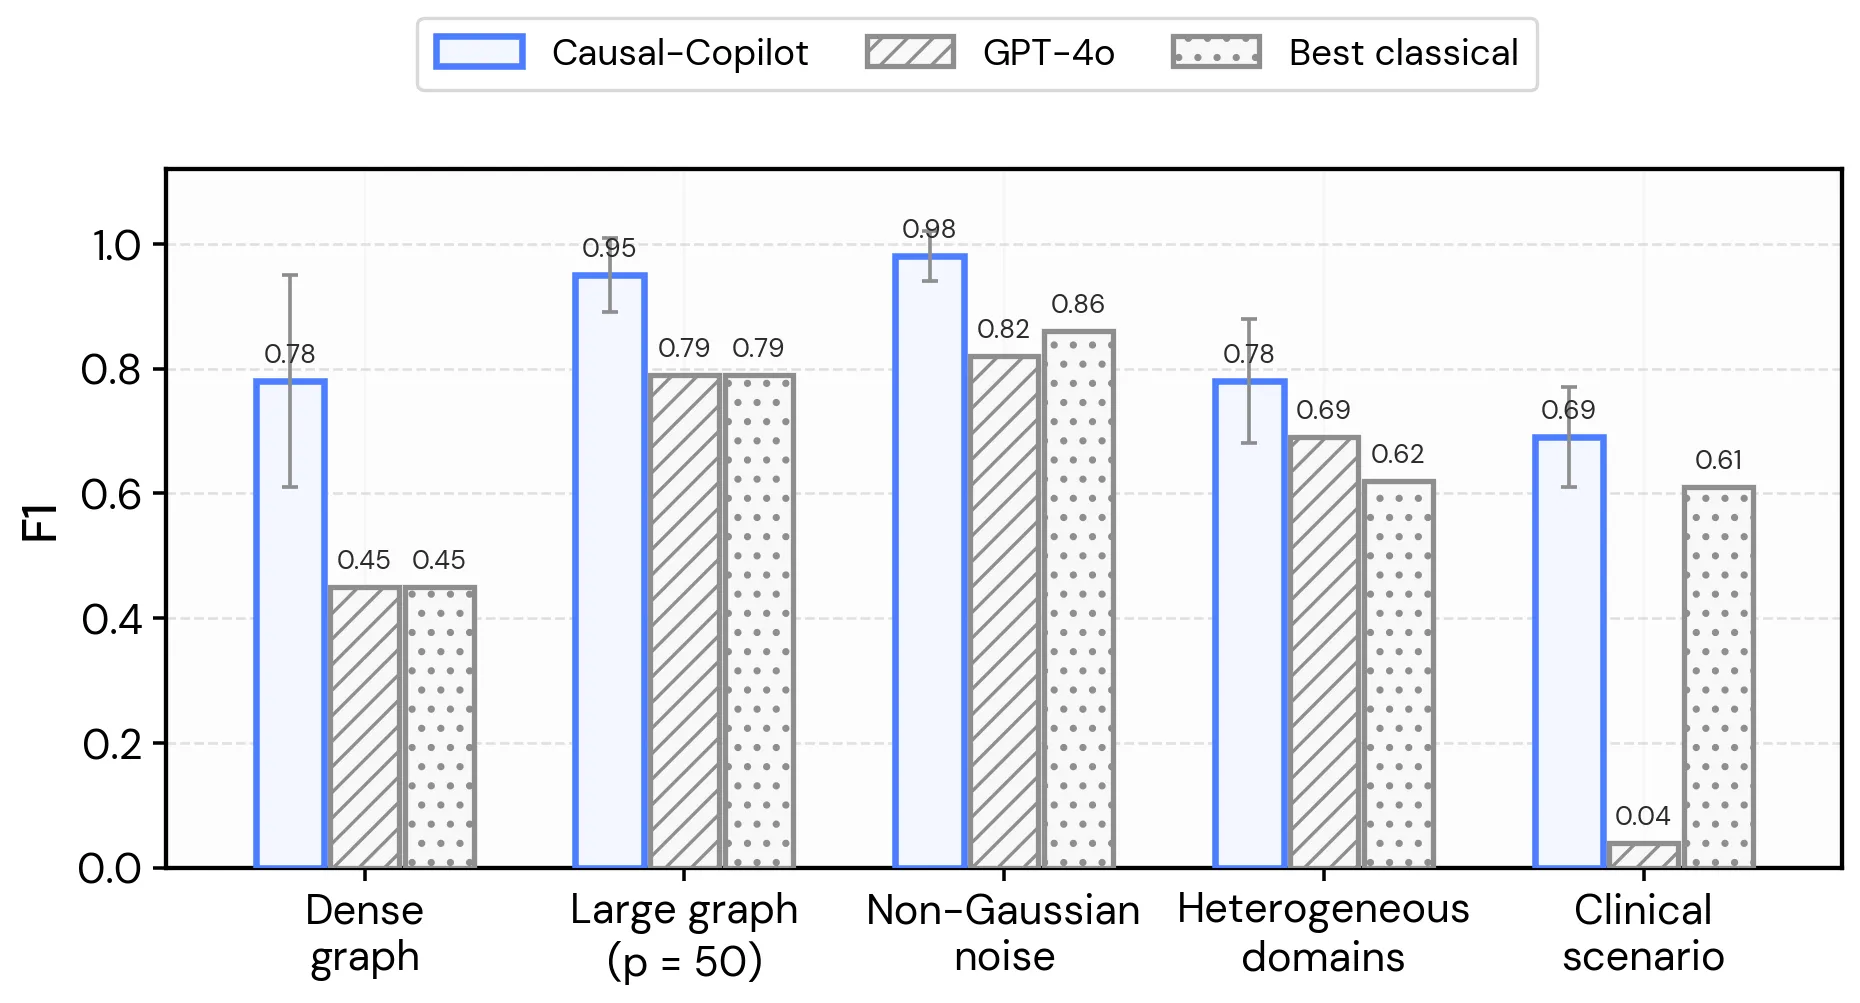 F1 across scenarios. Causal-Copilot against a GPT-4o agent given the same query and the same algorithm menu, and against the strongest classical method in each setting. Whiskers on Causal-Copilot are one standard deviation; the two baselines are reported without one.
Three things stand out.
The gap opens where hand-picking breaks down. On standard, well-behaved settings everything ties. Separation appears under density, scale and messy data — precisely the conditions real datasets arrive in.
The clinical scenario is the most telling. 0.69 against GPT-4o’s 0.04, on data combining discrete variables, measurement error, missing values and multiple domains. Same query, same algorithm menu, same underlying model. The difference is diagnosis: left to itself, GPT-4o defaults to a couple of familiar algorithms regardless of what the data looks like.
Some problems only one method finishes. Beyond the scenarios plotted above — at 500 nodes, at 1,000 nodes, and on a 1,000-node network scenario — the classical baselines and GPT-4o return N/A: they do not complete at all. Causal-Copilot still produces a graph.
Where it doesn’t win
On standard time-series settings it is competitive rather than dominant: F1 of 0.673 against PCMCI’s 0.695 and DYNOTEARS’ 0.733. Its advantages show up at the edges — high dimensionality, long lag structures and non-Gaussian noise, where it reaches 0.828 against 0.714 for the next best. And with very large samples, VAR-LiNGAM remains ahead.
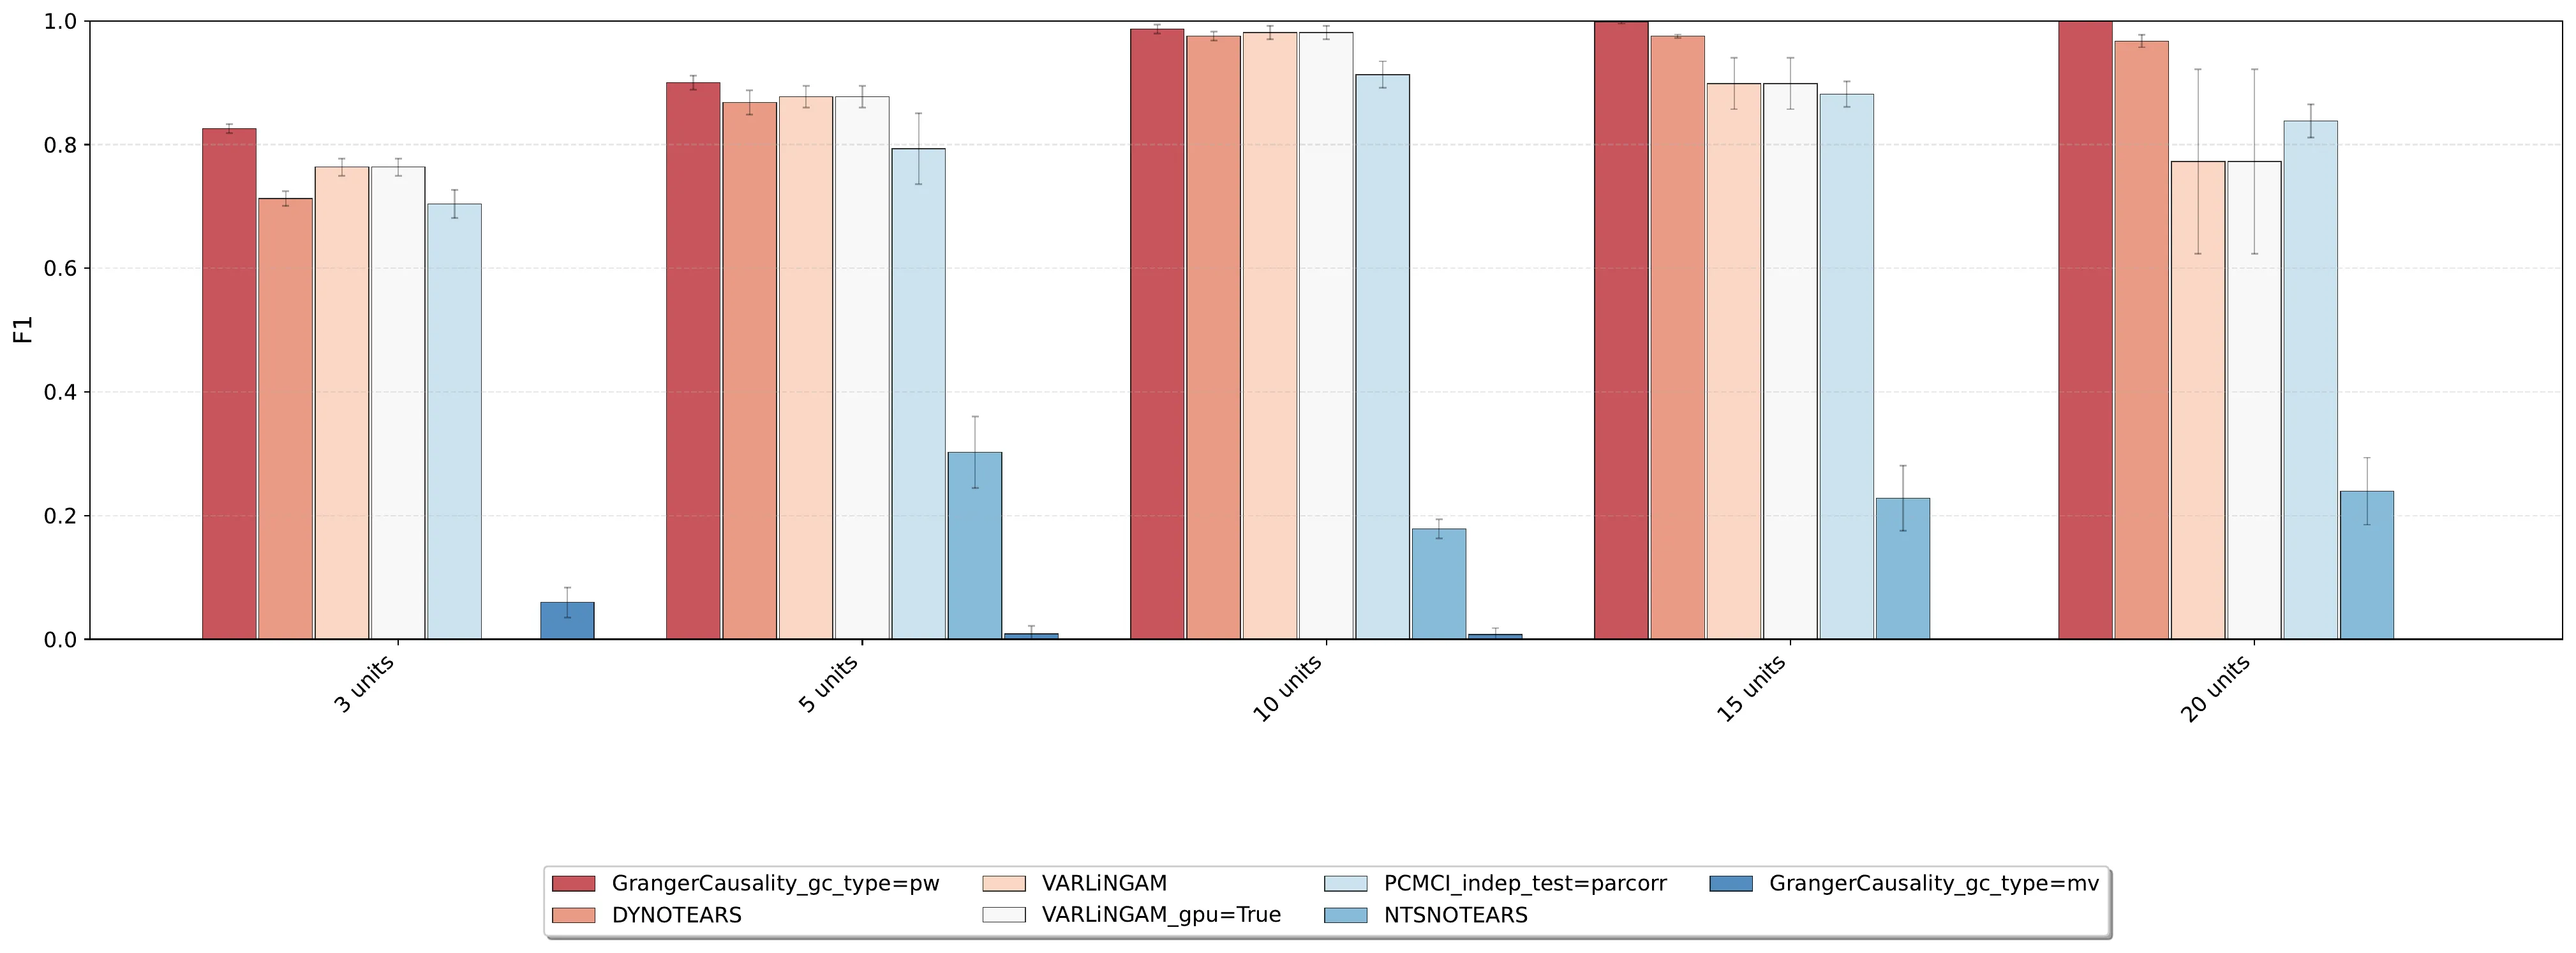 Where the time-series methods diverge. Average F1 against time lag. The methods are hard to separate at short lags — which is exactly why the standard setting is a tie — and spread out as dependencies stretch further back.
This is worth stating on the page rather than burying in an appendix. A system whose value proposition is honest method selection should be honest about the cases where the selection is a tie.
Use it
Run from the command line
python main.py --data_file data.csv --apikey YOUR_KEY \
  --initial_query "Discover causal relationships"

python Gradio/demo.py
There is a hosted demo, a Docker image and a browser chatbot interface.
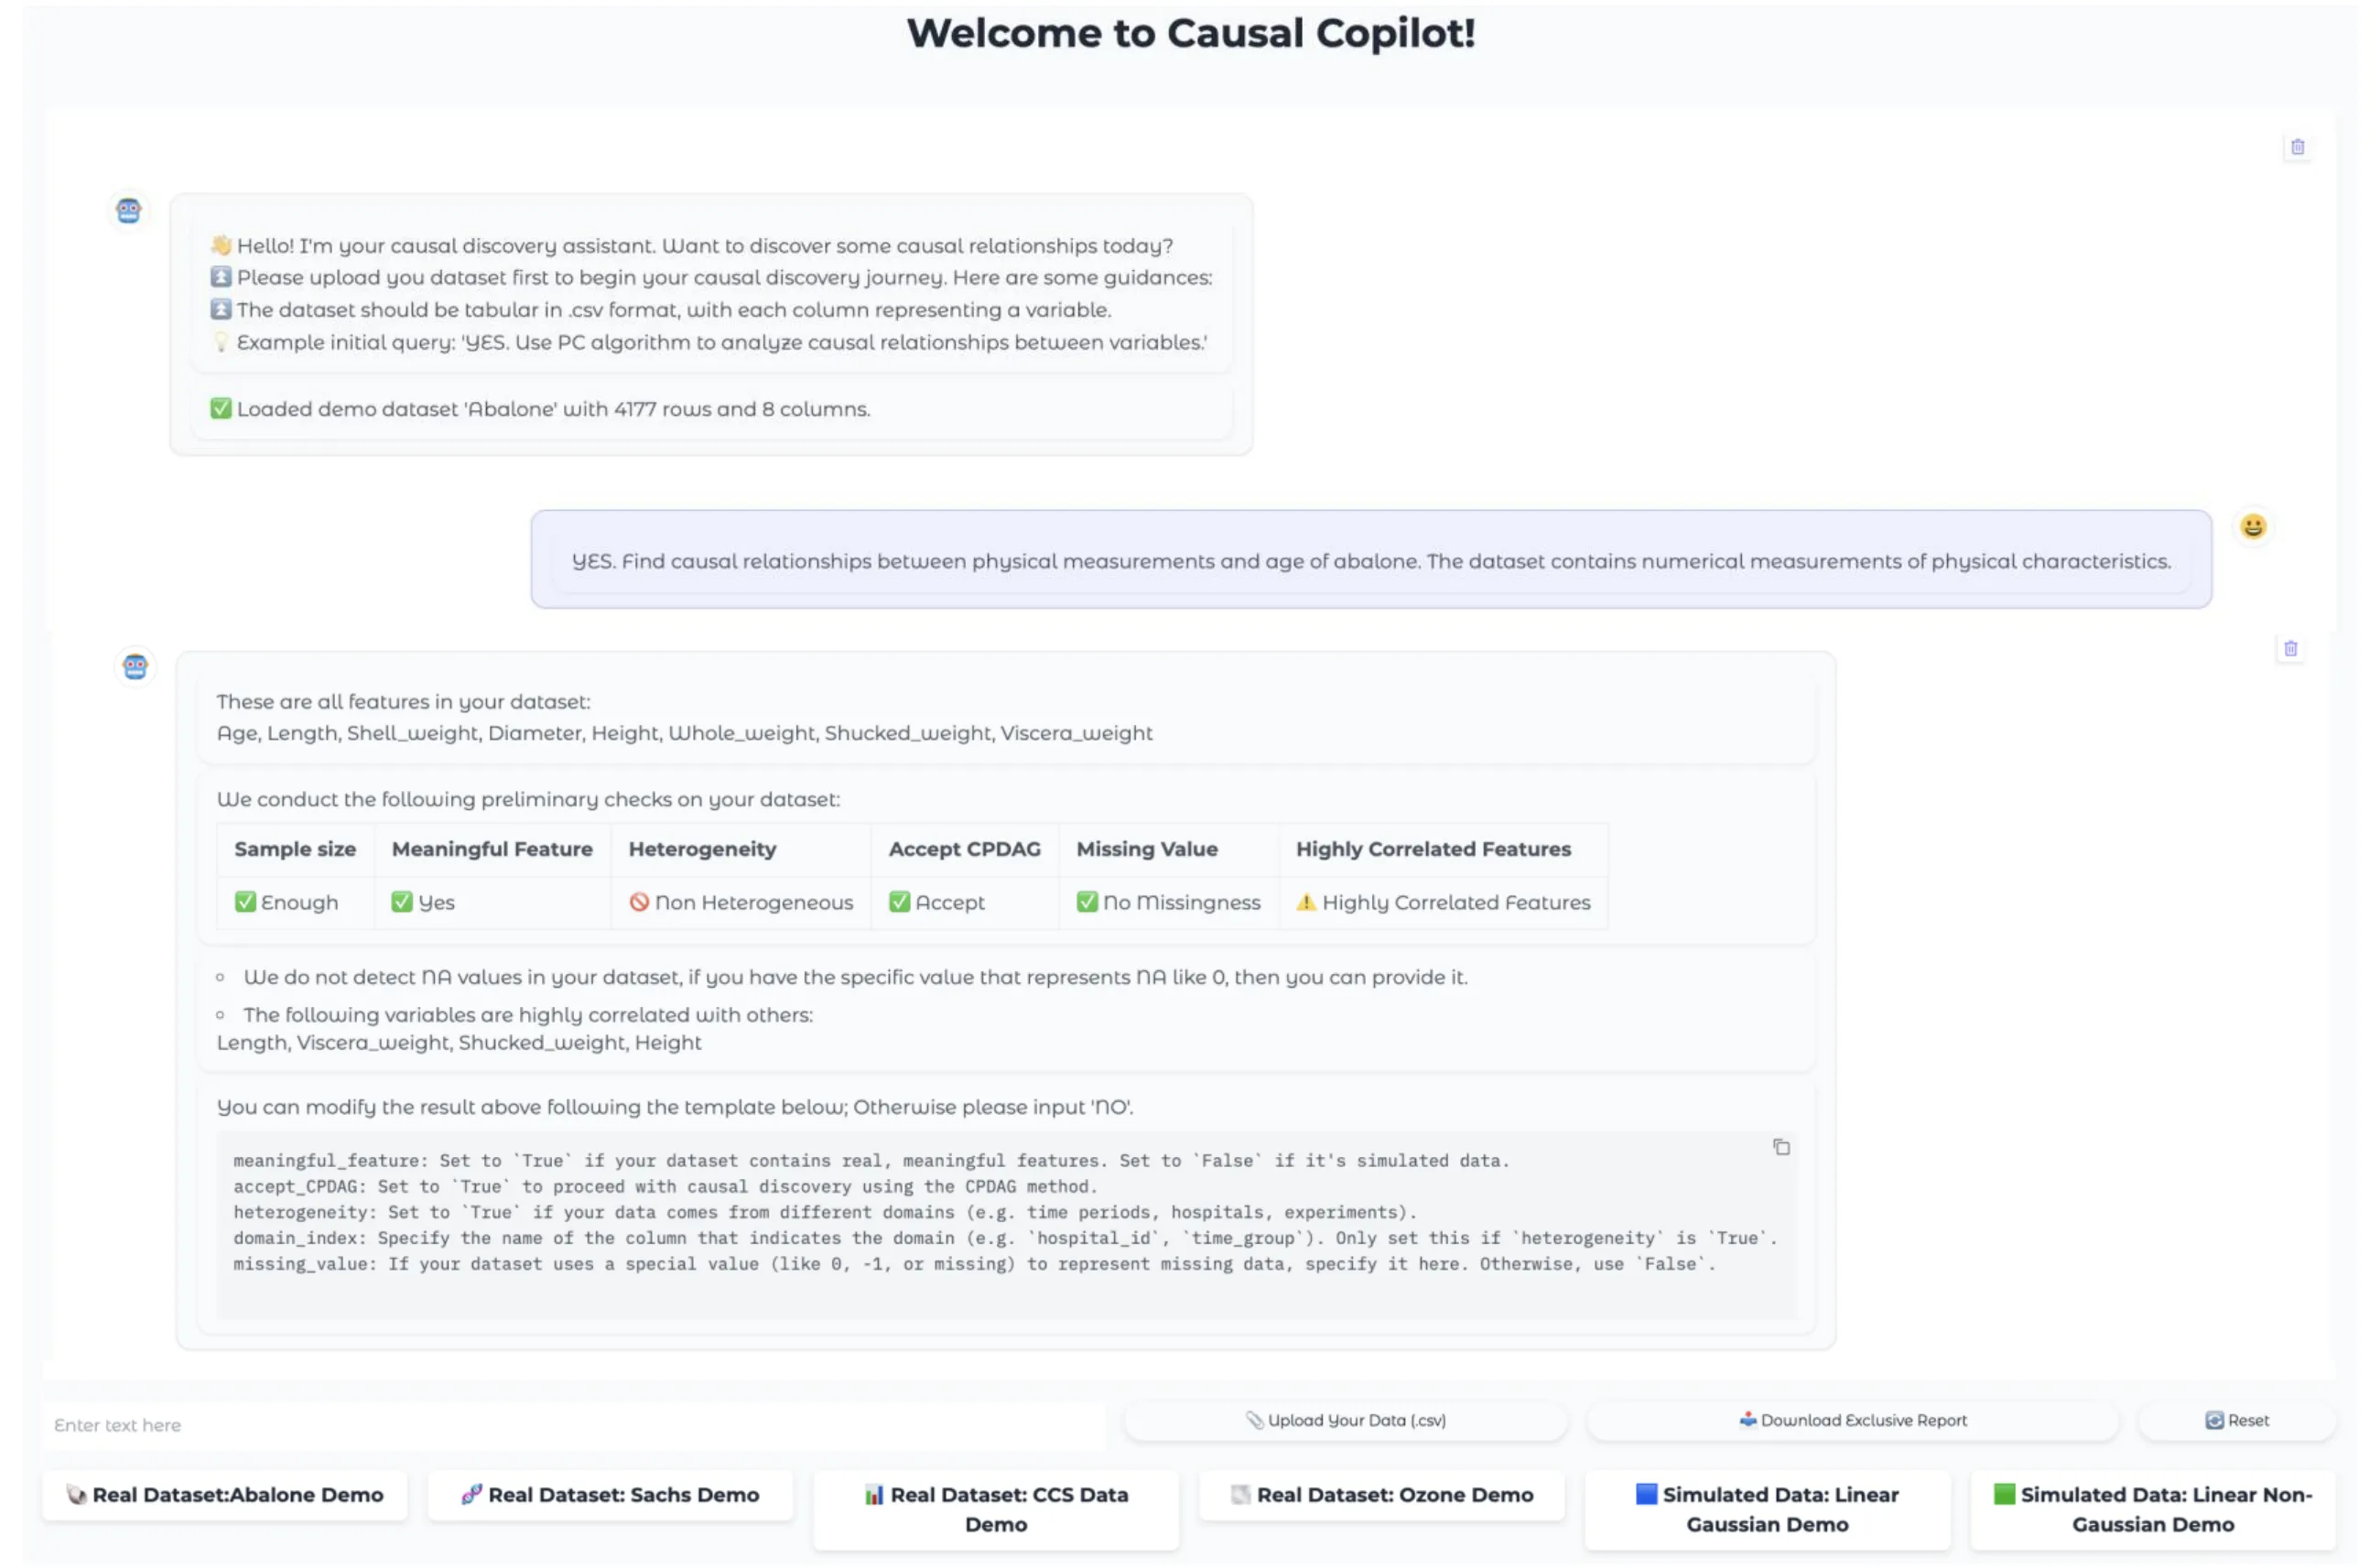 Web interface. The same pipeline driven through dialogue in the browser, for people who would rather not touch a command line.
The output is not just a graph or a number. It is a compiled report containing the dataset description, the statistics that drove the method choice, the discovered graph and an interpretation of it — something you can read, disagree with, and hand to a collaborator.
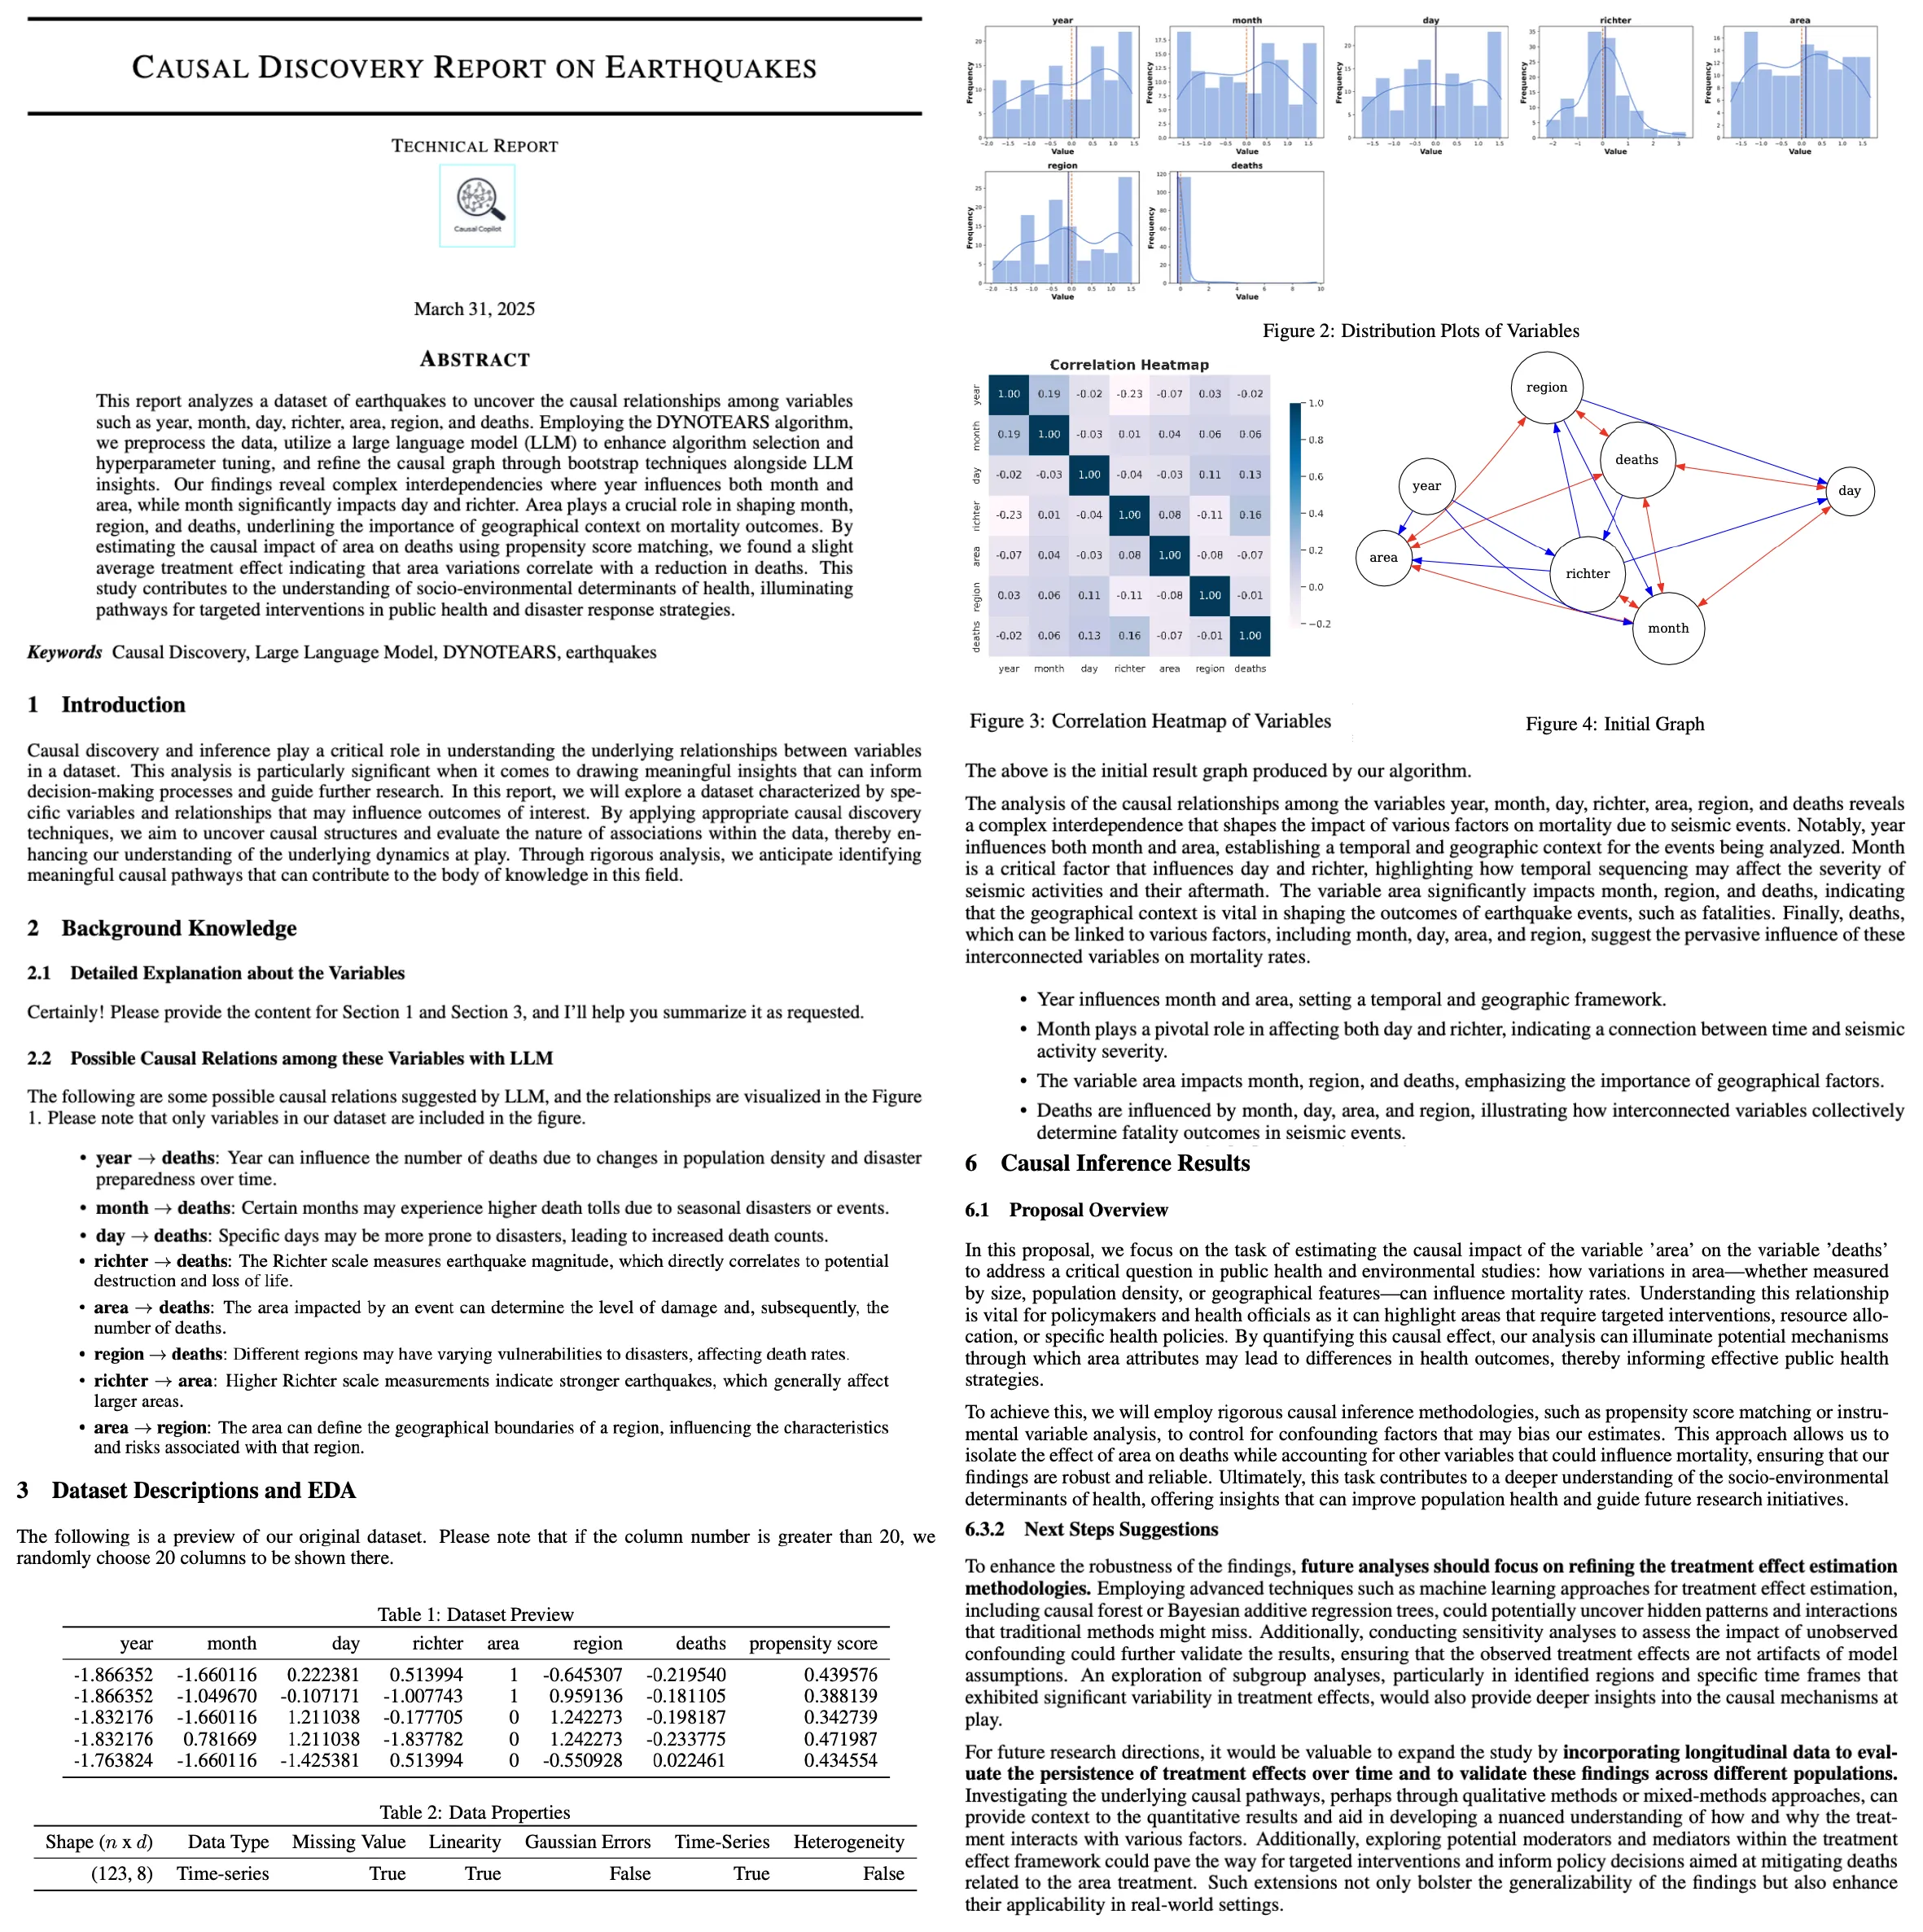 The artifact. A generated report: dataset description on the left; statistics, the discovered causal graph and the interpreted results on the right.